Shopify Statistics Australia 2026
Only 18 % of page-one results for Shopify statistics show a publish date. Our crawl of 278 results, 24 September 2026, sorts the figures worth quoting.

The short answer: No single 2026 figure tells you how Shopify is travelling in Australia, and any page that opens with one has skipped the checks. Our own crawl of page-one Google results for Shopify statistics, fetched on 24 September 2026, covered 29 queries and 278 results: 54 % of the domains were brand domains, and shopify.com alone held 43. Only 18 % of the pages we fetched showed a visible publish date. What can be dated is mostly global: Shopify Inc. reported 34 % year-over-year revenue growth for the quarter ended 30 June 2026, and $14.6 billion in Black Friday Cyber Monday 2025 sales. No Australian GMV, store count or market share figure passes a primary-source test. This page applies a three-check rule to every statistic: named source, as-of date, Australian definition.
Numbers about Shopify get copied between roundups until the source and the date fall off entirely. What survives is a figure nobody can check. This page is built to be cited instead: every line carries a sample size or a named source, and our own counts are labelled as ours.
If you are here to build rather than cite, our Shopify Australia setup guide handles the practical side.
What ranks on Google for shopify: our page-one study
Before quoting anyone's Shopify statistics, it helps to see what ranks. We fetched page-one results for 29 queries on 24 September 2026 and classified every result ourselves.
- 54 % — of page-one domains were brand domains, led by shopify.com (n = 278 results, our crawl, 24 September 2026).
- 43 — results from shopify.com, more than the next two domains, reddit.com and youtube.com, combined (n = 278, our crawl, 24 September 2026).
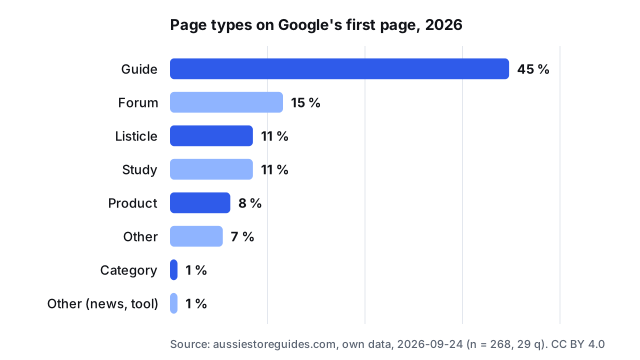
- 45 % — of fetched pages were guides, the largest page type (n = 268 fetched, our crawl, 24 September 2026).
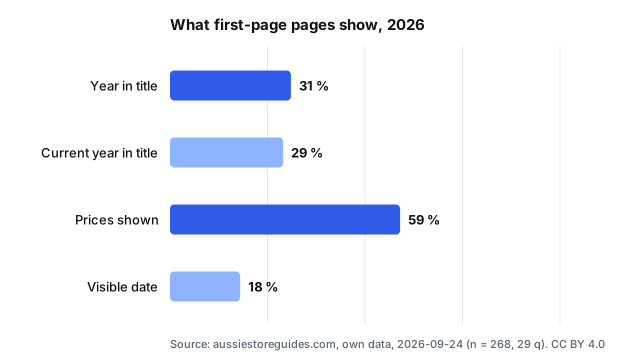
- 18 % — of fetched pages displayed any visible publish date (n = 268, our crawl, 24 September 2026).
- 1,689 words — median page length, with a range from 76 to 9,090 (n = 268, our crawl, 24 September 2026).
That last pair is the problem in one line: long pages, rarely dated. A sample of the queries:
| Query | Year in title | Prices shown | Median words | Top page type |
|---|---|---|---|---|
| shopify statistics 2026 | 100 % | 80 % | 2,479 | listicle |
| shopify statistics | 80 % | 70 % | 2,409 | listicle |
| how many shopify stores are there | 60 % | 78 % | 2,272 | guide |
| shopify cost australia | 25 % | 88 % | 1,953 | guide |
| online shopping statistics Australia | 40 % | 90 % | 1,583 | study |
Prices appear in most results because platform costs drive these searches. If that is your actual question, our Shopify Australia setup guide, the cost breakdown and the plan comparison calculator keep every AUD figure dated. App-cost pages run longest and date their figures least; our walkthroughs, such as StoreSEO for Shopify Australia, do it differently.
Shopify statistics from Shopify's own filings
One disclosure first: links to Shopify in this guide are affiliate links, so signing up through one earns us a commission, and you pay exactly the same. Now the numbers worth keeping. Shopify Inc. reports global figures dated to the quarter, which makes them the only Shopify performance statistics we treat as safe to quote.
- 34 % — year-over-year revenue growth for the quarter ended 30 June 2026 (Shopify Inc., 2026).
- 18 % — free cash flow margin in the same quarter (the same release, Shopify Inc., 2026).
- More than 30 % — growth across GMV, revenue, gross profit and free cash flow, in president Harley Finkelstein's words (Shopify's Q2 2026 announcement).
- $100 billion — global GMV Shopify says merchants cleared in the first quarter of 2026 (Shopify Inc., 2026).
- $14.6 billion — Black Friday Cyber Monday 2025 sales across Shopify merchants (Shopify Inc.'s BFCM report, 2025).
Guidance is quotable too, with its date: the company expects third-quarter 2026 revenue to grow at a low-thirties percentage rate, with free cash flow margin in the high-teens to low-twenties. Its claim that millions of businesses in 175+ countries use Shopify is a company statement, not a counted total. The annual 10-K for fiscal 2025 confirms the pattern: global totals, no Australian line.
Australian Shopify statistics that exist, and the gaps
Three questions bring people here, and none has a primary-source answer for Australia. That absence is the finding.
What share of Australian ecommerce runs on Shopify? Not published. The Australian Bureau of Statistics publishes monthly retail turnover, and its June retail release is exactly the kind of dated primary document this page wants. It splits nothing by platform.
How much GMV do Australian Shopify merchants generate? No source. Shopify reports GMV globally, and neither the Q1 nor the BFCM figure carries a country split.
What does the average Australian Shopify store earn, in AUD? No source either. Shopify does not publish an average order value, and any AUD revenue figure in a roundup is a modelled estimate.
What exists locally: the ABS series, Australia Post's regular ecommerce reporting on parcel volumes, and crawlers such as BuiltWith or Store Leads estimating live store counts. The crawls count websites, not sales, so they are directional only. Statista's Shopify topic page aggregates this material; treat it as an index to primary sources, never as the source itself.
Compare the sources before you quote a number
The whole thesis fits in one table. Which source can carry which claim:
| Source | Supports | Dated | Australian split | Our verdict | Cannot support |
|---|---|---|---|---|---|
| Shopify investor releases | Revenue, GMV, growth, cash flow | Quarter-end | No | Safe to quote, labelled global | AU store counts, share, AOV |
| Shopify help centre | Fees, features | Your retrieval date | Where noted | Safe to quote with date | Market size, adoption |
| ABS | Australian retail turnover | Monthly | Yes | Safe to quote | Platform splits |
| Australia Post ecommerce reports | Parcel volumes, behaviour | Per report | Yes | Safe for trends | Platform share, revenue |
| BuiltWith / Store Leads | Estimated live stores | Crawl date | Partial | Directional only | Sales, GMV, revenue |
| Unnamed roundups | Anything, secondhand | Rarely | Unclear | Skip | Anything cited elsewhere |
Our take: quote Shopify for Shopify's own results, the ABS for the Australian market, and nothing else without a date attached. The crawls are useful for scale, never for sales. If a roundup is your only source for a number, that number is not ready to plan a store budget around.
When to skip a Shopify statistic entirely
The walk-away test is three questions. Our suggested version, ready to copy:
- Primary source: is Shopify Inc., the ABS or a named research house cited?
- As-of date: does the sentence carry a quarter, month or crawl date?
- Australian scope: does it state global, regional or Australian, outright?
One fail means caveat the figure. Two fails mean skip it. Our crawl shows the stakes: only 18 % of fetched pages displayed any date at all.
How we counted
We pulled page-one results, 10 per query, for 29 Shopify and Australian ecommerce queries on 24 September 2026, using our hub search layer. That gave 278 results. We fetched content from 268 of them; 10 were blocked or unreadable, and those are excluded from page-level rates such as the date and price percentages. Each fetched page was classified by type and measured for word count, year in title, prices shown and visible date. Domain counts cover all 278 results. Every figure in our sections is our own count, rounded no further than the data.
Previous years
This is the first edition of this page, published on 24 September 2026; the 2027 refresh will move these figures down here unchanged.
Sources
- Shopify Inc., Shopify Delivers Big: 30%+ Growth Across GMV, Revenue, Gross Profit, and Free Cash Flow — checked on 24 September 2026.
- Shopify Inc., Shopify Delivers Again as Merchants Clear $100 Billion in Q1 GMV — checked on 24 September 2026.
- Shopify Inc., Shopify merchants generate record-breaking $14.6 billion in Black Friday Cyber Monday sales — checked on 24 September 2026.
- Statista Research Department, Shopify - statistics & facts — checked on 24 September 2026.
- Australian Bureau of Statistics, Retail sales surge in June — checked on 24 September 2026.
- Shopify Inc., Annual Report on Form 10-K for the fiscal year ended December 31, 2025 — checked on 24 September 2026.
Download the data
The aggregates on this page are Aussie Store Guides's own data (never per-product prices or third-party text). Each file carries the snapshot date, the sample size and the method.
Licence CC BY 4.0: you may reuse these figures and charts by crediting Aussie Store Guides with a link to this page.